Fun with OCT!

Dear Diary,

It’s been a short week so this will probably a short post.  As you know, FoMD (Fouling of Membrane Distillation) and I are still going strong.  We’ve experimented every day this week!  Last week I created the model of the materials that we should see using Visual MINTEQ.  After having those two old programs fighting over me last week, I haven’t had to use either one this week.

This week I got another new toy scientific tool to use.  And to be honest, Diary, if anything can steal me away from FoMD, it is this new tool.  It is an Optical Coherence Tomography microscope (OCT) and it is used for microscopy.  Microscopy is a sciency word (AKA fancy) for “the use of a microscope.”  This one, however, is not like your high school biology microscopes.  An OCT uses near-infrared light beams to reflect off of the object to create an image.  But wait, it gets even cooler.  The infrared beams can penetrate a lot of objects so it also creates 3D images.   Below is a picture of the whole setup.  The OCT is on the right and sitting below the lens is a USB flash drive.  On the computer screen, you can see a picture of the flash drive in the bottom right with the letter Y clearly visible.  The big image is the microscopic view of the flash drive (whitish blue, mostly hidden by the orange) with part of the letter Y (green) and a lot of noise created by the plastic (orange and pink at the top and bottom of the image).  Each pixel created by the program is 1µm or about 1/20th the thickness of human hair and the different colors indicate different densities.  I was told that I can put anything I want under OCT as encouragement to learn how to use OCT.  I have to level with you, Diary, my first ideas went all the way back to the five-year-old me with “I should put boogers under the microscope!”  Sometimes I’m proud that I’m not growing up…this was not one of those times.

OCT and I are going to have lots of fun together creating images of the membranes that FoMD and I are fowling up.  The next image is a membrane that only had de-ionized water pass through it so there should be no fouling.   This creates a nice standard of what a clean membrane will look like since we might find parts of other membranes that are clean.  This image is showing a piece of the membrane that is less than 2mm by 2mm.

Here is a membrane that was in FoMD for nearly 48 hours and had a lot of salt build up or “fouling.”  You can see that there is still a lot of clean membrane visible but there are also cool salt structures.  Using another feature, bottom picture, we can start to see what pores became “wet” which is membrane distillation speak for “got contaminates in the pore so now liquid water can pass through the pore.”  As you can see, “wet” is a much friendlier term.  The wet pores have large downward cones visible in this side view image.

Guess what else, Diary?  Next week I get to start putting these cells into other new toys scientific tools (I can’t believe I keep making that mistake) to determine what those solids are.  I don’t remember what these toys’ names are but that helps make them more mysterious.  The solisd should match the precipitates determined by the Visual MINTEQ program that I was using last week.  One can only hope!

I guess this post wasn’t as short as I expected, oh well.  Until next week, Diary – Chay

Week 4 is out the door!!

Hope everyone enjoyed their holiday.  Can’t believe it is the conclusion of our fourth week and still so much to accomplish.  Despite a short week much progress was made.  Continued to evaluate our samples of suspended TiO2 in hopes of developing a safe and sustainable detection method.  I have been wanting to share this photo of the nanosizer and zetapotential instrument.  Crazy how this instrument can measure the smallest of particles.  It just blows my mind!!


Began the protocol for my lesson in extracting the chelating properties of cilantro and then putting them to the test.  Here are some pics for you to enjoy.

This is all for now.  Next week I plan to have completed the protocol and see some results.

The search continues…

So how do I tie in all the research that has been done so far and find something meaningful to my teaching and incorporate NEWT’s experience?  In order to involve my 8th graders into the assessing of the WEB program at school and its impact, I decided to get scientific and do some additional research on qualitative and quantitative methodologies.  Both are so incredibly important when doing any experiment and while WEB is a set program with its own curriculum, the results can vary immensely from school to school.  Our school’s major goal every year is to improve the obvious; academic performance, an aspect that WEB is meant to help with.  But at a school that has such intense diversity and socioeconomic status, as mine is, there is also a concern for a reduction in bullying, attendance, and behavior.  These four aspects are the topics that I want my 8th graders to gather data around.  How to put that into a qual and quan research approach is left to be constructed.  This is my homework for week 5 with Dr. Carberry.

Aside from the WEB research, Dr. Carberry and I wanted to lend some professional development opportunities to science teachers in my district.  We want to offer expertise in areas where we never get attention and as stated last week, we RARELY ever get good, meaningful science based PD.  When this internship began and Adam talked with me about education based research and qualitative and quantitative methods, I am not going to lie;  I was a little lost at knowing the difference.  THAT IS SAD! I am a 6th grade science teacher.  Our school and district requires that we do thorough assessments of our students learning yet we are not trained to survey it well or collect it in a multiple of ways.  I think this idea of research could be beneficial not only to my 8th grade WEB leaders but to ALL kids.  A professional development opportunity where teachers can learn about both and how to implement them into their classrooms AND then teach their kids through experiments to do the same. The PD  would hit every avenue and make every science teacher that much better.

To tie both ideas into NEWT and RET/REU, my plan is to research members of both to see what their professional development internship experience brought them this summer.  What kind of research was done? Was it beneficial?  What was the importance of it?  Through my collection of evidence I want to practice both methods so that I can get objective and subjective information.

WHEW…. I think I have a plan. 🙂


Looks Promising!

The ZIF-67 with GO worked!! The concentrations of Methylene Blue dropped to almost zero if not zero. This was true for the four concentrations tested, 12.5 ppm, 25, ppm, 50 ppm, 100 ppm.

Fresh water with MB at 50 ppm (left) vs fresh water with MB at 50 ppm treated with ZIF-67@GO. The difference is clear!


Now, all the samples are going to be sent to a different lab to analyze the concentration of the ions and the ICP-MS of the solutions.

Updates to follow!!

Week 3 with Polyvalent Phages!

Hello All!

I guess my journey with Laccase enzyme has ended this week 🙁 The visiting scholar is so busy with her research and she is facing some issues with her project as well and I don’t want to bother her any longer.  I am hoping that before she leaves for Spain, I can continue with what we have started.

The following were the highlights this week;

a)  Dr. Yu showed me how to perform the Drop Spot Test.  He needs to do this to confirm the efficiency of the phages (in different dilutions) we have been using and check the condition of the bacterial stock as well since we have been having not so good results in our efficiency test.  We found out from this test that the bacteria we’re using has been contaminated with phages.  The test also revealed that there was so much media in the solution, so there is a need to purify the phage as well.

b)  Dr. Chu showed me the process of purifying the phage solution.

c) I was taught how to harvest/isolate and purify phages of interest from a plate.  I think this is the best take away for the week.  I have been wondering how to isolate the phage from the culture.  After isolating the phage, we did the efficiency test for the phage to determine its polyvalency.  It’s amazing that these phages come from one source and grew in the same culture plate yet they can evolve so fast.

d)  We also did a growth curve for the bacteria used in the efficiency test to determine it’s growth over 14 hours  using the plate reader.

Dr. Yu asked me to do more literature review on colorimetric detection of different bacterial host.  This is the direction of my project.  I was able to find some interesting articles but I am not sure If we can conduct the experimentation in the lab considering the time left. This is a big project and they haven’t started it so far.  I am contributing to the project by reading articles on how to do it.  I feel good about it although it is a pain searching and reading articles but my mentor is grateful for all my efforts 🙂

I am feeling the pressure already.  It seems like time flies so fast especially if there’s a lot of things that you want to accomplish.  However, I am taking it one day at a time and enjoying every moment of the experience! Till then….

Sections of the agar sliced using a scalpel containing the viral plaques of interest for isolation.


Efficiency Test. Phage showed higher infectivity on the host in the right plate through more viral plaques formation.
Plate wells containing the two (2) different bacterial hosts for the growth curve test.

Bio teacher Week 3

A bit late but I must say I feel like I’m making progress! This week my mentor let go of my hand and I had to complete several tasks all by myself!  I got to make emulsions (water and oil in a sonicator), NaCl test, Threshold test for the MNP, and a wash test.  The reason I feel progress has been made is because I had to make calculations on my own, and create my own procedures.  I did double check my math with my mentor and walked through the process with her but I was on my own.

 Here is the NaCl setup. I prepared emulsions with .05%, 1%, 2% and 3% NaCl.  (white lids)


Prepared samples. NaCl emulsions have been combined with nanoparticles.

  Mixer for 24 hours.
 Here are the results.

NaCl had no apparent effect on the  destabilization of emulsions by functionalized MNP

Another Week Down

This week certainly went by quickly.  One day this week I had the opportunity to place the bottlebrush polymer into a solution containing vinyl ether and a photo initiator. This is a pre-step before using the flow coater to cast the thin film polymer.  The  chemistry to make the solution was quite the refresher! Just goes to show if you don’t use some skills for a long time, they can get rusty! We then let the solution sit refrigerated until the next day.  Next we ran it through the flow coater.  I think I got better at using the flow coater machine this time around. Once the bottle brush polymer samples were cast onto the silica wafer,  then we took the polymer coated silica wafers to a UV reactor and put in the UV bulbs ourselves. You can change the intensity of the UV light by the different types of bulbs there. We used a radiometer to calculate the amount of UV in the machine and allowed it to stabilize before placing our samples created from the flow coater to set. My understanding is that the UV light will further crosslink the polymers. Now I have been spending the remainder of the week testing the thickness of all of the different wafers via the good ol’ faithful ellipsometer. Then they have been washed for 10 minutes and then thickness measured again to see how effectively they have been crosslinked.

On  a separate I would say the highlight of my week was getting to go on lab tours with the other NEWT RET’s here and getting to see some of the awesome things they are also doing in their labs. Happy Independence Day/Week etc. everyone! Getting better at the flow coater

Weekly Update

Well another week down and it has been pretty interesting.  In our lab we are trying to finds ways to detect TiO2 through a colorimetric process by utilizing various chelating agents.  This process, once its successful will be used to detect any seepage of TiO2 after the filtration process.  The goal is to keep the chelate and TiO2 in a suspended form and remain as a nanoparticle in order to allow the colorimetric process to work.  This entailed measuring the nanopartilce complex through a nanosizer.  Measured all the all the different ligands (ran over 300 samples) and adjusted their pH in order to change the polaritiy of the ligand in order to prepare it for colorimetric attachment.  It has been a tedious process, however, the unknown is what keeps it exciting.  Lets see what happens this upcoming week.

I have made some great progress with the lesson.  Will use the chelating proprieties found in plants to demonstrate the chelation process that is occurring in the lab.  I am developing a lab activity protocol that will involve the extraction of the chelating properties in cilantro.  Then then add the extraction to a known concentration of an aqueous iron solution.  Finally, use a colorimetric process to determine the concentration of the free iron in solution.  The free iron will then be measured using a spectrometer.  As an enrichment activity students will then propose (based on research and experience) how plants may be engineered as part of the water filtration process.   Next week I will give the protocol its first run.  If all goes well (which I think it will) then I will be able to complete my lesson.

Until next time!!  Hope is everything is going well for everyone.  Enjoy your weekend!!!  Happy 4th!!


ZIF-67 a Possible Success!

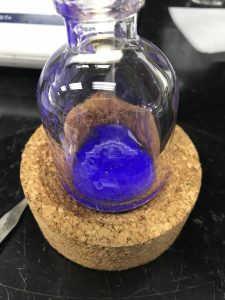
Solution
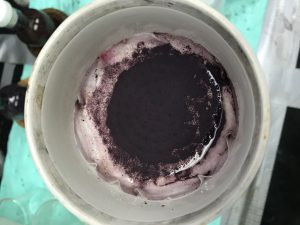
Rinsing of ZIF
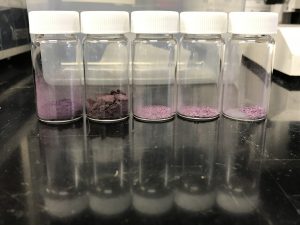
Dried ZIFs


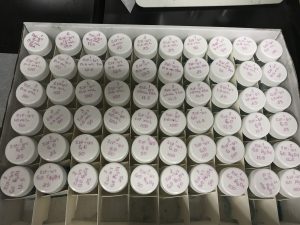
ZIF Vials


This week was a rather busy week. It started with creating ZIF-67 so that we can test its efficiency in cleaning Methyl Blue in fresh water solutions. The process started on Friday June, 23. After all of the ZIFs were collected, we remade the control ZIFs with GO Fe3O4 NPs and nonmagnetic GO. In total there are 60 samples


This week we will analyze each sample and see if this truly cleaned out the water as he had hoped. Some of the samples started cleaning the water without being stirred-very promising!

More info and pictures to come!

ASU Week 2 – THM and other acronyms

The major highlight this week was that the phrase “THMs are a DBP caused by TOC levels, sodium hypochlorite, and bromide from raw water”  actually makes sense to me now. (It didn’t make sense at first).  And I also got to use a THM analyzer and I completed THM profiles of the building where we work.

So I am discovering that the vernacular of water science is starting to make sense.  When I did the Chandler water plant tour, they had a process that used “ballasted floc”.  At the time, all I understood was that a ballasted floc system took up less space, processed water faster, and needed sand.  Then it dawned on me a couple days later, the sand is ballast and the floc sinks faster so they called it “ballasted floc”.

The same thing happened with the THMs.  The most common one is chloroform (there’s three others).  To me, chloroform was just a name of something in water.  And then I saw the formula: CHCl3.  Hey, I know what that is; it’s trichloromethane from organic chemistry.  It’s like tricholorethane that I researched in college, and it’s similar to carbon tetrachloride and other chlorofluorocarbons like freon.    Making that connection, I now have a better feel for THMs and why we don’t want them in out drinking water.  So from my background knowledge of similar chemicals, I can predicted that THMs will be volatile, they are linked to  cancer, they will have low water solubility, they are weakly polar, they probably contribute to global warming and ozone depletion, and they might form radicals.

FYI,  DBP stands for disinfection by-products, TOC stands for total oxidizable carbon, THM stands for Trihalomethanes, and FYI stands for for your information.

So this week I used a THM analyzer.  It’s new so I wrote up a brief user guide with pictures.  I started by analyzing the water in the ISTB4 building where we are doing the internship.  I found THMs every place I checked.  I’m not sure what numbers are significant or not, but I found a 20% difference on different floors of the building and I found a 20% difference depending on the day of the week, and I found about a 20% difference depending on the time of day.  Let’s just say that I recommend that you fill your water bottle up on Friday, just after lunch, in an active kitchen.  FYI, every reading was within water quality specs.

Richard


Rice University, Arizona State University, & University of Texas – El Paso